
Recently, the possibility of an inverted yield curve has worried some observers because it is generally a good indicator of an economic recession. So, what is a yield curve, and why might it invert?
Bonds and Yields
Suppose an investor has $1,000 they’d like to save for the future. One option they have is to lend that money out in exchange for an “IOU”, a promise to, at some future date, repay the original sum along with a pre-arranged amount of interest. For instance, they could promise to pay back $1,100 in 3 years in exchange for borrowing $1000 today from the investor.
This “IOU” is a bond, and the interest paid is the bond’s yield (in percentage terms). Following the example above ($100 of interest in exchange for the original $1,000), the yield would be 10%. This “yield” is the rate of return bond sellers receive for lending out their money. Furthermore, the amount of time between the initial lending and the date of payment is called the “maturity”. In this example, the maturity would be 3 years.
Bonds can be much more complicated, but we can still make sense of the yield curve by keeping things simple.
So What is a Yield Curve?
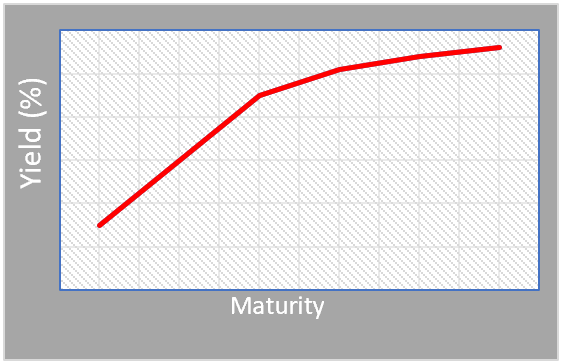
A yield curve is a way of depicting the relationship between the yield and maturity for a specific type of bond. For a “normal” yield curve, a bond that has a lower maturity (i.e., a shorter duration) carries a lower rate of return, whereas a bond with a higher maturity carries a higher yield.
Often, economists and financial professionals refer to “the” yield curve, which is simply the yield curve of United States Treasury bonds. These are important because they’re generally what investors refer to as the “risk-free” rate, a benchmark for comparison with other bond types.
The Yield Curve is Flattening
Presently, the yield curve appears to be flattening. The graph below depicts a common way of visualizing the yield curve. It plots the difference between long-term and short-term treasury rates, which is the average slope of the yield curve.
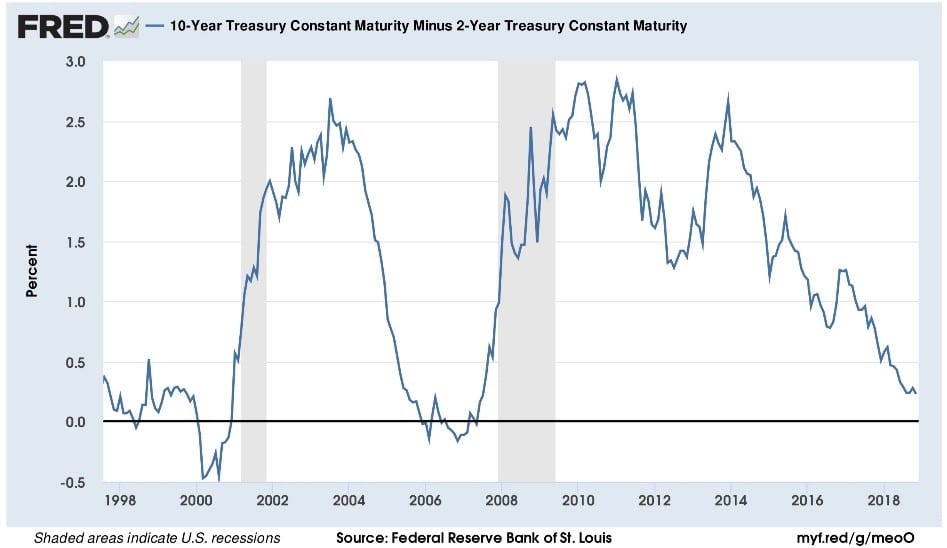
The closer the difference between long-term and short-term rates are to 0, the flatter the yield curve is. Sometimes, the yield curve even “inverts”, which is when short-term yields are greater than long-term yields. As shown above, the long-term and short-term bond rates are trending towards equaling out, and possibly, a yield curve inversion.
Several explanations for a flattening yield curve exist: short term yields could be increasing, long term yields could be decreasing, or some mix of the two. To understand which of these trends are occurring, a closer look at the data is needed.
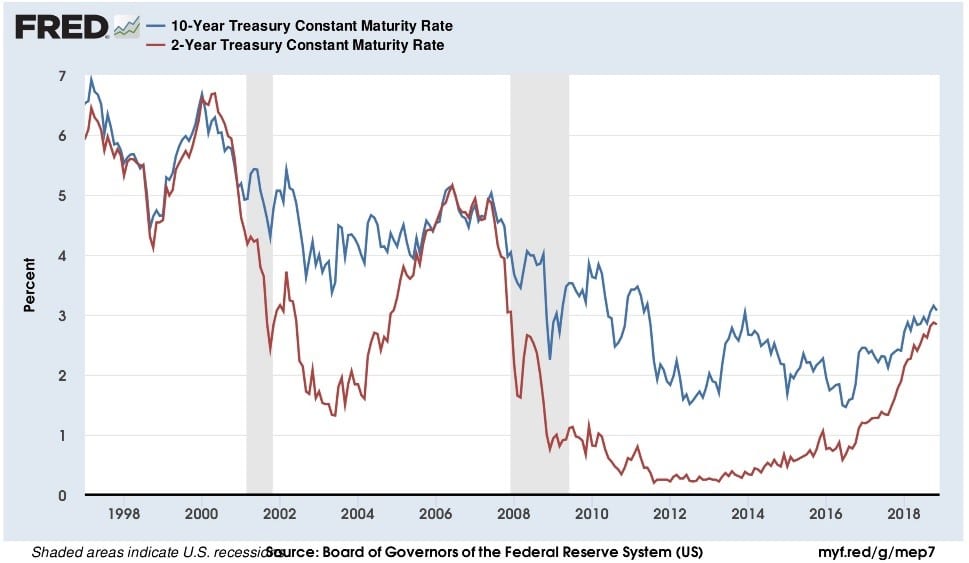
The image above depicts short-term bond yields in red and long-term bonds yields in blue. Over the past 4 years, short-term yields are rising while long-term yields are staying relatively constant.
Why might short-term yields be going upward? Short-term rates are much more responsive to Federal Reserve policy than long term rates, and with the Federal Reserve starting to raise interest rates over the last year, short-term rates have risen as well. Furthermore, yields on T-bills (short-term government bonds) also tend to rise when the economy is in expansion.
Experts are generally uncertain about why long-term yields have stayed so constant. Some experts believe that investors expect low rates of inflation in the future. Without high inflation expectations, investors might not seek as high of a return to make up for losses from inflation. Additionally, the rest of the world’s demand for safe assets to invest in (such as long-term US government bonds), their high demand may has created a savings glut. Due to this glut, the US government can take on more debt without having to pay higher returns on government bonds (yields).
The variety of possible explanations for short term rates rising and long-term rates leveling suggests some measure of caution being warranted for investors. If long-term yields hold steady while short term yields continue to rise, long-term rates could eventually fall below short-term rates—an inversion of the yield curve. While there is disagreement over how significant an inversion would be, it would at least create worry among investors, economists, and the Federal Reserve, so all eyes in the financial sector will be on the yield curve in the coming months.
Photo Credit: © 2012, 401kcalculator.org
Graphs taken from FRED courtesy of the Federal Reserve Bank of St. Louis
